Pending Home Sales Snapshot
Infographic
In February 2023, pending home sales were up 0.8% month-over-month.
Existing-Home Sales Housing Snapshot
Infographic
February 2023 brought 4.58 million in sales, a median sales price of $363,000, and 2.6 months of inventory. The median sales price is down 0.2% year-over-year, and inventory was up 0.9 months from February 2022.
Why Hire an Agent Who is a REALTOR®
Infographic
Why Hire an agent who is a Realtor®?
There's much more to selling a home than some people think. But if you work with a Real Estate Agent who is a REALTOR®, selling a home is easy.
There's much more to buying a home than some people think. But if you work with a Real Estate Agent who is a REALTOR®, buying a home is easy.
Metro Areas With Largest Percent Gain in Existing Single-Family Home Home Price in 2022 Q4
Infographic
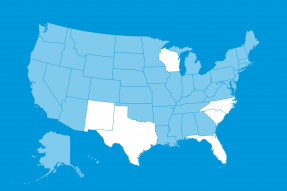
Seven of the 10 metro areas with the largest percent gains in existing single-family home price in 2022 Q4 were in Florida and North or South Carolina and the others were in New Mexico, Texas, and Wisconsin.
Housing Shortage Tracker
Infographic
This measure computes how many new permits are issued for every new job for 178 metro areas.
Local Broker Marketplaces in Action
Infographic
See the value of local broker marketplaces by contrasting our current system against a world without the MLS.


